Retrieving custom networks from OSM using Pyrosm and translating to Pandana and NetworkX

Introduction
Pyrosm is a very clever python library, written by Henrikki Tenkane, that allows users to quickly and effectively retrieve data from OpenStreetMap, using Cython and Protocolbuffer Binary Format -files (PBFs). It is ultimately the most useful tool to retrieve OSM data within python and is fairly well documented.
Yet, there were few places which can be confusing and where extended description and tutorial is needed. This is specifically;
- retrieving custom network (cycling example)
- converting custom network to Pandana/Networkx graph
In this tutorial, I'll also repeat the distances calculation with pandana from this post and update on any changes.
I would have like to contribute to the Pyrosm library with the first point, however, Cython is not amongst my skills right now. So if someone knows how to do that, feel free.
Retrieving custom driving/walking/cycling network
The Pyrosm uses custom_filter to define what features should be extracted from the PBF, however, this filter is not available for the networks. Instead the Pyrosm offers get_data_by_custom_criteria() and keep vs exclude feature which allows you to define which keys to keep or exclude from the OSM. This function also allows you to choose if you want to keep the nodes in the data, but those are not the network nodes, those are point features that has the tags defined in your custom filter. This means, that you can get custom network, but only the edge list. However, in order to construct graph in Pandana we need both edge list and node list. Now you could just get the edge list, create a graph in Networkx and then translate to Pandana by exporting edgelist and node list out, but let's be realistic. If there is a way to avoid multiple conversions and installing another package, I would be much happier.
I found an easy way to retrieve both nodes and edges for custom created network. The process is as follows;
- Retrieve complete network for the selected area
- Filter out the edges features based on selected keys from OSM
- List all the existing nodes in the edge dataframe
- Filter the nodes by the list from the previous step
# import the necessary packages
import geopandas as gpd
import pandas as pd

# import pyrosm functions
from pyrosm import OSM
from pyrosm import get_data
# network libraries
import pandana
import networkx as nx
def get_network_custom(place,filter_type):

    """
    place: string
        name of the pbf to be downloaded

    filter_type: string
        'cycling' only for now
    """
    # connect to the data
    osm = OSM(get_data(place))

    ## if you have already downloaded pbf file and it’s in your file directory use following
    ## osm = OSM(place)
    ## where place is 'filepath.pbf'

    # retrieve the complete network
    nodes,edges = osm.get_network(nodes=True, network_type="all")


    # define the filter
    if filter_type == 'cycling':
        highway = ['primary',
                'primary_link',
                'trunk',
                'trunk_link',
                'secondary',
                'secondary_link',
                'tertiary',
                'tertiary_link',
                'unclassified',
                'residential',
                'living_street',
                'road',
                'service',
                'track',
                'path',
                'pedestrian',
                'footway',
                'bridleway',
                'cycleway',
                'busway']
    else: raise ValueError('try cycling')
    # you could define other profiles such as driving or walking

    # choose only those edges that are inside the filter
    edges = edges[edges['highway'].isin(highway)]

    # list origin nodes
    list_origins = list(edges.u.unique())

    # list destination nodes
    list_destinations = list(edges.v.unique())

    # combine the to lists to see all nodes that exist in filtered network
    list_nodes = list_origins + list_destinations

    # cut the nodes by the existing list
    nodes_gdf = nodes[nodes.id.isin(list_nodes)]

    return nodes_gdf,edges
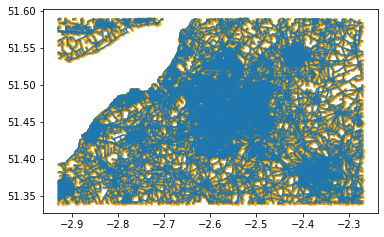
nodes, edges = get_network_custom('Bristol','cycling')
ax = edges.plot()
nodes.plot(ax = ax, color = 'orange', markersize = 2);
Converting custom network to pandana/networkx graph
Converting the two geodataframes to graphs is then dead easy.
nodes.info()
<class 'geopandas.geodataframe.GeoDataFrame'>
Int64Index: 515871 entries, 0 to 522320
Data columns (total 8 columns):
 #   Column     Non-Null Count   Dtype
---  ------     --------------   -----
 0   lon        515871 non-null  float64
 1   lat        515871 non-null  float64
 2   tags       20935 non-null   object
 3   timestamp  515871 non-null  int8
 4   version    515871 non-null  int8
 5   changeset  515871 non-null  int8
 6   id         515871 non-null  int64
 7   geometry   515871 non-null  geometry
dtypes: float64(2), geometry(1), int64(1), int8(3), object(1)
memory usage: 25.1+ MB
edges.info()
<class 'geopandas.geodataframe.GeoDataFrame'>
Int64Index: 551813 entries, 0 to 560619
Data columns (total 43 columns):
 #   Column          Non-Null Count   Dtype
---  ------          --------------   -----
 0   access          45542 non-null   object
 1   area            10881 non-null   object
 2   bicycle         40145 non-null   object
 3   bridge          2960 non-null    object
 4   busway          84 non-null      object
 5   cycleway        7300 non-null    object
 6   est_width       785 non-null     object
 7   foot            87694 non-null   object
 8   footway         5027 non-null    object
 9   highway         551813 non-null  object
 10  int_ref         0 non-null       object
 11  junction        6390 non-null    object
 12  lanes           30165 non-null   object
 13  lit             49202 non-null   object
 14  maxspeed        97150 non-null   object
 15  motorcar        672 non-null     object
 16  motorroad       8 non-null       object
 17  motor_vehicle   8631 non-null    object
 18  name            202888 non-null  object
 19  oneway          49142 non-null   object
 20  overtaking      61 non-null      object
 21  path            835 non-null     object
 22  passing_places  47 non-null      object
 23  psv             873 non-null     object
 24  ref             25646 non-null   object
 25  service         45451 non-null   object
 26  segregated      13048 non-null   object
 27  sidewalk        38667 non-null   object
 28  smoothness      2099 non-null    object
 29  surface         145345 non-null  object
 30  tracktype       5161 non-null    object
 31  tunnel          1281 non-null    object
 32  turn            7 non-null       object
 33  width           3221 non-null    object
 34  id              551813 non-null  int64
 35  timestamp       551813 non-null  int64
 36  version         551813 non-null  int8
 37  tags            183067 non-null  object
 38  osm_type        551813 non-null  object
 39  geometry        551813 non-null  geometry
 40  u               551813 non-null  int64
 41  v               551813 non-null  int64
 42  length          551813 non-null  float64
dtypes: float64(1), geometry(1), int64(4), int8(1), object(36)
memory usage: 181.6+ MB
# This might be necessary if you get the error
## ValueError: Buffer dtype mismatch, expected 'long' but got 'double'
nodes2 = nodes.set_index('id')
# create pandana graph
pandana_graph = pandana.Network(nodes2['lon'],
                           nodes2['lat'],
                           edges['u'],
                           edges['v'],
                           edges[['length']],
                           twoway=[False,True])
# create networkx graph
networkx_graph = nx.from_pandas_edgelist(edges,source = 'u', target = 'v', edge_attr = 'length')
Calculating shortest distance between set of points using pandana
pois = gpd.read_file("./points.geojson")
pois2 = pois.rename(columns = {'ID_code':'code_ID'})
import itertools
def get_shortest_path(points, polygons, point_id, poly_id, Graph):
    # check the projections
    if points.crs != 'EPSG:4326':
        raise ValueError("The point CRS is not Mercator, Use gpd.to_crs('EPSG4326') to transform the CRS")

    if polygons.crs != 'EPSG:4326':
        raise ValueError("The polygon CRS is not Mercator, Use gpd.to_crs('EPSG4326') to transform the CRS")

        """
        Parses graph and two sets of locational datasets and returns dataframe with Origin destination ids, distances and times along the network.

        Parameters
        ----------
        point : point geodataframe
        polygons : polygon or second point geodataframe
        point_id : str
            unique ID column of points
        poly_id : str
            unique ID column of polygons or the second points
         Graph: object
            pandana.network

        Returns
        -------
        dataframe with distances and times between each pair of points

        Return type
        -----------
        pandas.dataframe
        """


    # define the unique origins and destinations
    origins = list(points[point_id].unique())
    destinations = list(polygons[poly_id].unique())
    # create OD data
    od_data = pd.DataFrame(list(itertools.product(origins,destinations))).rename(columns = {0:point_id,1:poly_id})
    # add coordinates to the data
    # if the data is other then points, it would take centrooid of the geometry

    if points.type[0] == 'Point':
        point_xy = pd.DataFrame({point_id: points[point_id], 'X':points.geometry.x, 'Y':points.geometry.y}).reset_index(drop=True)
    elif points.type[0] == 'MultiPoint':
        point_xy = pd.DataFrame({point_id: points[point_id], 'X':points.geometry.x, 'Y':points.geometry.y}).reset_index(drop=True)
    else: point_xy = pd.DataFrame({point_id: points[point_id], 'X':points.geometry.centroid.x, 'Y':points.geometry.centroid.y}).reset_index(drop=True)


    if polygons.type[0] == 'Point':
        poly_xy = pd.DataFrame({poly_id: polygons[poly_id], 'X':polygons.geometry.x, 'Y':polygons.geometry.y}).reset_index(drop=True)
    elif polygons.type[0] == 'MultiPoint':
        poly_xy = pd.DataFrame({poly_id: polygons[poly_id], 'X':polygons.geometry.x, 'Y':polygons.geometry.y}).reset_index(drop=True)
    else: poly_xy = pd.DataFrame({poly_id: polygons[poly_id], 'X':polygons.geometry.centroid.x, 'Y':polygons.geometry.centroid.y}).reset_index(drop=True)

    # build origin destination data
    od_data = od_data.merge(point_xy, on=point_id, how = 'left').merge(poly_xy, on = poly_id, how = 'left')

    # find nodes on the network
    origin_nodes = Graph.get_node_ids(od_data.X_x, od_data.Y_x).values
    dests_nodes = Graph.get_node_ids(od_data.X_y, od_data.Y_y).values

    # find the distances and times
    od_data['distance'] = pd.Series(Graph.shortest_path_lengths(origin_nodes, dests_nodes, 'length'))


    return od_data
import time

start = time.time()

dists = get_shortest_path(points = pois, polygons = pois2, point_id = 'ID_code', poly_id = 'code_ID', Graph = pandana_graph)

end = time.time()
print(end - start )
9.235082149505615
dists.distance.hist();
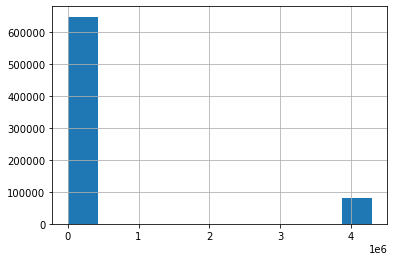
Notes: You can see that there is a suspicious distance that are bigger than 300 000 meters. This happens when the graph can't find the route for set of two points. This is most likely because one of the nodes is on disconnected graphs within the network and can't reach the other ones, or they could be outside the graph extent or something else. It would be smart to investigate the graph, but that’s not part of this post :)