Distribution of Children homes in Czech Republic
Institutional care
Introduction
My friend, that is currently completing Phd in Social studies and pedagogy, has asked me to create some maps for her thesis. Primary topic for these should be an institutional care in Czech Republic
- Distribution of Children homes across Czech
- Choropleth map of relative distribution (per capita) of the homes across Czech districts.
Data
Data needed to complete those maps are
- Register of schools and school facilities in CR - XML database
- Population in municipalities - as of 1.1.2020 - CSV table
- A set of administrative boundaries and boundaries of cadastral territories of the Czech Republic - shp spatial layer in WGS84 projection
Notes
Be aware that Czech republic has its own projection; JTSK (EPSG:2065), in which all the maps are drawn. We might use it or not, just giving you heads up.
Preparation
Packages
# Necessary for munging the files
import xml.etree.cElementTree as ET # XLM manipulation package
import requests
import pandas as pd
import numpy as np
import geopandas as gpd
import logging
import time
# Necessary for geocoding
from geopy.geocoders import Nominatim
from shapely.geometry import Point
import matplotlib.patheffects as pe
import getpass
from geopy.extra.rate_limiter import RateLimiter
# plotting
import folium
from folium.plugins import MarkerCluster
from folium import IFrame
import pysal as ps
import mapclassify
import libpysal as lp
import matplotlib.pyplot as plt
Projection shortcuts
wgs84 = {'init':'EPSG:4326'}
jtsk = {'init':'EPSG:2065'}
Data loading
# population csv
popul = pd.read_excel('./pocet_obyvatel.xlsx', sheet_name='List1')
# spatial layer of districts
distr = gpd.read_file('./SPH_SHP_WGS84/WGS84/SPH_OKRES.shp')
distr.crs = wgs84
region = gpd.read_file('./SPH_SHP_WGS84/WGS84/SPH_KRAJ.shp')
region.crs = wgs84
country = gpd.read_file('./SPH_SHP_WGS84/WGS84/SPH_STAT.shp')
country.crs = wgs84
# data about institutions
xml_str = requests.get('https://rejstriky.msmt.cz/opendata/vrejcelk.xml').text
Data preview
popul.head()
| ID | okres | pocet obyvatel | kraj | |
|---|---|---|---|---|
| 0 | CZ0100 | Hlavní město Praha | 1324277 | Středočeský kraj |
| 1 | CZ0201 | Benešov | 99414 | Středočeský kraj |
| 2 | CZ0202 | Beroun | 95058 | Středočeský kraj |
| 3 | CZ0203 | Kladno | 166483 | Středočeský kraj |
| 4 | CZ0204 | Kolín | 102623 | Středočeský kraj |
country.plot()
region.plot()
distr.plot()


xml_str[0:500]
'<?xml version="1.0" encoding="utf-8"?>\r\n<ExportDat>\r\n <DatumVystupu>2021-01-05T21:30:01.2452138+01:00</DatumVystupu>\r\n <PravniSubjekt>\r\n <RedIzo>600000206</RedIzo>\r\n <ICO>49625918</ICO>\r\n <Reditelstvi>\r\n <RedPlnyNazev>Mateřská škola sv. Voršily v Praze</RedPlnyNazev>\r\n <RedZkracenyNazev>Mateřská škola sv. Voršily v Praze</RedZkracenyNazev>\r\n <RedRUAINKod>21702101</RedRUAINKod>\r\n <RedAdresa1>Ostrovní 139/11</RedAdresa1>\r\n <RedAdresa2>Nové Město</RedAdresa2>\r\n '
Extracting data from XML using ElementTree package
How do I know what does the tree looks like?
Fisrtly, the source should always give you a metadata about the structure of the data, as it is in this case. However, you can find out by inspecting the file and the individual children of the tree.
# pass the string to elemt tree
etree = ET.fromstring(xml_str)
# inspect the childern
etree.getchildren()[1]
<Element 'PravniSubjekt' at 0x000001A475D1D950>
etree.getchildren()[1].getchildren()
[<Element 'RedIzo' at 0x000001A475D1D090>,
<Element 'ICO' at 0x000001A475D1D180>,
<Element 'Reditelstvi' at 0x000001A475D20770>,
<Element 'SkolyZarizeni' at 0x000001A475BED9A0>]
etree.getchildren()[1].getchildren()[3].getchildren()
[<Element 'SkolaZarizeni' at 0x000001A475BED8B0>,
<Element 'SkolaZarizeni' at 0x000001A475BA9720>]
How do I extract some of the data and get then into a dataframe
In this case we know that all the information is part of one child and should have the same number of records, so we can just iterate through the tree, list all the text and assign it to dataframe. You can do this only if you are sure that the order of the data and their number matches.
ID = []
for typ in etree.iter('IDMista'):
ID.append(typ.text)
ruian = []
for typ in etree.iter('MistoRUAINKod'):
ruian.append(typ.text)
druh = []
for typ in etree.iter('MistoDruhTyp'):
druh.append(typ.text)
address_1=[]
for typ in etree.iter('MistoAdresa1'):
address_1.append(typ.text)
address_2=[]
for typ in etree.iter('MistoAdresa2'):
address_2.append(typ.text)
address_3=[]
for typ in etree.iter('MistoAdresa3'):
address_3.append(typ.text)
print(len(ID))
print(len(ruian))
print(len(druh))
print(len(address_1))
print(len(address_2))
print(len(address_3))
38295
38295
38295
38295
38295
38295
Perfect!
df = pd.DataFrame(np.column_stack((ID, ruian, druh, address_1, address_2, address_3)), columns = ['ID', 'ruian','druh','address_1', 'address_2', 'address_3'])
df
| ID | ruian | druh | address_1 | address_2 | address_3 | |
|---|---|---|---|---|---|---|
| 0 | 049625918 | 21702101 | Mateřská škola | Ostrovní 139/11 | Nové Město | 110 00 Praha 1 |
| 1 | 102413096 | 21702101 | Školní jídelna | Ostrovní 139/11 | Nové Město | 110 00 Praha 1 |
| 2 | 107500884 | 21852201 | Mateřská škola | Ke Kamýku 686/2 | Kamýk | 142 00 Praha 4 |
| 3 | 161102263 | 21852201 | Školní jídelna - výdejna | Ke Kamýku 686/2 | Kamýk | 142 00 Praha 4 |
| 4 | 110034384 | 21851018 | Mateřská škola pro děti se zdravotním postižením | Smolkova 567/2 | Kamýk | 142 00 Praha 4 |
| ... | ... | ... | ... | ... | ... | ... |
| 38290 | 181118084 | None | Lesní mateřská škola | pozemky p. č. 546/1, 481/40, 2292,568/56 | k. ú. Třebechovice pod Orebem | None |
| 38291 | 181118106 | 3147045 | Mateřská škola | Bohumínská 37/158 | Muglinov | 712 00 Ostrava |
| 38292 | 181118114 | 3147045 | Školní jídelna | Bohumínská 37/158 | Muglinov | 712 00 Ostrava |
| 38293 | 181118190 | 2509008 | Mateřská škola | č.p. 77 | 281 63 Oplany | None |
| 38294 | 181118203 | 2509008 | Školní jídelna - výdejna | č.p. 77 | 281 63 Oplany | None |
38295 rows × 6 columns
Filter out only children homes
dd = ['Dětský domov']
df2 = df[df['druh'].isin(dd)]
df2.head()
| ID | ruian | druh | address_1 | address_2 | address_3 | |
|---|---|---|---|---|---|---|
| 4902 | 150069812 | 3089011 | Dětský domov | Přestavlky 1 | 257 91 Sedlec-Prčice | None |
| 4911 | 150018312 | 2929724 | Dětský domov | Racek 1 | 256 01 Chlístov | None |
| 4928 | 151038147 | 5936675 | Dětský domov | Mládeže 1102/8 | Beroun-Město | 266 01 Beroun |
| 4974 | 048706302 | 1377931 | Dětský domov | č.p. 55 | 273 05 Ledce | None |
| 5027 | 150036787 | 11647388 | Dětský domov | Poštovní 593 | 285 22 Zruč nad Sázavou | None |
More filters
We know that some of the homes are duplicated as they might have two buldings on the same postodes but one is the actual home and the second is for example a food providing facility. To avoid duplicated places, we need to separate the postcode from adress and select only the first from duplicated postcodes.
# split the adress string, the postcode is always in the first 6 caracters
df2['address_4'] = df2['address_2'].str[0:6]
df2['address_5'] = df2['address_3'].str[0:6]
# find rows in second part of adress that does not have a postcode
df2['is_5'] = df2['address_5'].isnull()
# logical argument
# if the postcode is in the second part of adress, fill column with it, if its not, fill it with te first part adress postcode
df2['postcode'] = np.where( (df2['is_5'] == False) , df2['address_5'], df2['address_4'])
# voala
df2
| ID | ruian | druh | address_1 | address_2 | address_3 | address_4 | address_5 | is_5 | postcode | |
|---|---|---|---|---|---|---|---|---|---|---|
| 4902 | 150069812 | 3089011 | Dětský domov | Přestavlky 1 | 257 91 Sedlec-Prčice | None | 257 91 | None | True | 257 91 |
| 4911 | 150018312 | 2929724 | Dětský domov | Racek 1 | 256 01 Chlístov | None | 256 01 | None | True | 256 01 |
| 4928 | 151038147 | 5936675 | Dětský domov | Mládeže 1102/8 | Beroun-Město | 266 01 Beroun | Beroun | 266 01 | False | 266 01 |
| 4974 | 048706302 | 1377931 | Dětský domov | č.p. 55 | 273 05 Ledce | None | 273 05 | None | True | 273 05 |
| 5027 | 150036787 | 11647388 | Dětský domov | Poštovní 593 | 285 22 Zruč nad Sázavou | None | 285 22 | None | True | 285 22 |
| ... | ... | ... | ... | ... | ... | ... | ... | ... | ... | ... |
| 30762 | 150066147 | 11165901 | Dětský domov | č.p. 204 | 750 02 Stará Ves | None | 750 02 | None | True | 750 02 |
| 30763 | 181078538 | 11164361 | Dětský domov | č.p. 47 | 750 02 Stará Ves | None | 750 02 | None | True | 750 02 |
| 30769 | 150008660 | 22885871 | Dětský domov | Lazec 2 | 261 01 Příbram | None | 261 01 | None | True | 261 01 |
| 33321 | 151019142 | 22855521 | Dětský domov | č.p. 22 | 261 01 Dubenec | None | 261 01 | None | True | 261 01 |
| 33382 | 151035351 | 22551166 | Dětský domov | Čs. tankistů 277/11 | Dolní Měcholupy | 109 00 Praha 10 | Dolní | 109 00 | False | 109 00 |
243 rows × 10 columns
# drop all the postcode duplicates and keep the first records for the duplicates
df2.drop_duplicates(subset ="postcode",
keep = 'first', inplace = True)
df2.info()
<class 'pandas.core.frame.DataFrame'>
Int64Index: 167 entries, 4902 to 33382
Data columns (total 10 columns):
# Column Non-Null Count Dtype
--- ------ -------------- -----
0 ID 167 non-null object
1 ruian 165 non-null object
2 druh 167 non-null object
3 address_1 166 non-null object
4 address_2 167 non-null object
5 address_3 47 non-null object
6 address_4 167 non-null object
7 address_5 47 non-null object
8 is_5 167 non-null bool
9 postcode 167 non-null object
dtypes: bool(1), object(9)
memory usage: 13.2+ KB
We now have 167 records of the Childrens home, we know it is suppose to be 137 so there is still 30 places extra. Those could be separate buildings with different postcodes but belonging to one institution. We have no information about this so lets just leave it for now and get to the geocoding.
Geocoding the addresses
# clean the data a little
df3 = df2.iloc[:,[0,1,2,3,4,9]]
# create column with full address
df3['plna'] = df3['address_1'].map(str) + ' , ' + df3['address_2'].map(str)
df3.head()
| ID | ruian | druh | address_1 | address_2 | postcode | plna | |
|---|---|---|---|---|---|---|---|
| 4902 | 150069812 | 3089011 | Dětský domov | Přestavlky 1 | 257 91 Sedlec-Prčice | 257 91 | Přestavlky 1 , 257 91 Sedlec-Prčice |
| 4911 | 150018312 | 2929724 | Dětský domov | Racek 1 | 256 01 Chlístov | 256 01 | Racek 1 , 256 01 Chlístov |
| 4928 | 151038147 | 5936675 | Dětský domov | Mládeže 1102/8 | Beroun-Město | 266 01 | Mládeže 1102/8 , Beroun-Město |
| 4974 | 048706302 | 1377931 | Dětský domov | č.p. 55 | 273 05 Ledce | 273 05 | č.p. 55 , 273 05 Ledce |
| 5027 | 150036787 | 11647388 | Dětský domov | Poštovní 593 | 285 22 Zruč nad Sázavou | 285 22 | Poštovní 593 , 285 22 Zruč nad Sázavou |
Using GoogleV3 engine to ceocode the addresses
# define the engine and limiter
geolocator = Nominatim(user_agent="GoogleV3")
geocode = RateLimiter(geolocator.geocode, min_delay_seconds=1)
# Define Google API key
key = getpass.getpass('Password:')
# pasweord can be found in your google acount under API & Services. if you dont have any active one, you need to create one
#https://console.developers.google.com/apis/credentials?project=annular-garden-259610
Password:
# create a column with geocoded address
df3['location'] = df3['plna'].apply(geocode)
# create a column with point coordinates
df3['point'] = df3['location'].apply(lambda loc: tuple(loc.point) if loc else None)
df3.head()
| ID | ruian | druh | address_1 | address_2 | postcode | plna | |
|---|---|---|---|---|---|---|---|
| 4902 | 150069812 | 3089011 | Dětský domov | Přestavlky 1 | 257 91 Sedlec-Prčice | 257 91 | Přestavlky 1 , 257 91 Sedlec-Prčice |
| 4911 | 150018312 | 2929724 | Dětský domov | Racek 1 | 256 01 Chlístov | 256 01 | Racek 1 , 256 01 Chlístov |
| 4928 | 151038147 | 5936675 | Dětský domov | Mládeže 1102/8 | Beroun-Město | 266 01 | Mládeže 1102/8 , Beroun-Město |
| 4974 | 048706302 | 1377931 | Dětský domov | č.p. 55 | 273 05 Ledce | 273 05 | č.p. 55 , 273 05 Ledce |
| 5027 | 150036787 | 11647388 | Dětský domov | Poštovní 593 | 285 22 Zruč nad Sázavou | 285 22 | Poštovní 593 , 285 22 Zruč nad Sázavou |
We can see some of the places has not been found so lets do one more round but with partial address only (postcode, city).
Once that is done, there is actually some residual of addresses that was not geocoded at all so let me just skip ahead and add them in manually, right now.
df3['address_2'][df3['ID'] == '110023587'] = '49.154827045632665, 17.996702689654494'
df3['address_2'][df3['ID'] == '150070446'] = '49.715585698531825, 17.902557782916908'
df3['address_2'][df3['ID'] == '110005414'] = '49.70128584452374, 17.077698497646164'
df3['address_2'][df3['ID'] == '150068999'] = '49.828035620591606, 17.77214007066865'
df3['address_2'][df3['ID'] == '150070411'] = '49.975334977613926, 17.73716291115126'
df3['address_2'][df3['ID'] == '150012012'] = '49.88712758017286, 16.867843041835485'
df3['address_2'][df3['ID'] == '102175594'] = '49.53657949442161, 15.351256882293946'
df3['address_2'][df3['ID'] == '102464537'] = '49.79357507981935, 12.624905338126101'
df3['address_2'][df3['ID'] == '181056381'] = '50.48084538132141, 13.426100477617592'
df3['address_2'][df3['ID'] == '102177899'] = '50.72867195615058, 15.184360530266257'
df3['address_2'][df3['ID'] == '048159638'] = '50.072083156427496, 15.986443039170952'
df3['address_2'][df3['ID'] == '102406227'] = '50.33954862443628, 16.314161709055785'
df3['address_2'][df3['ID'] == '181103532'] = '49.70512665455396, 16.342441590148137'
df3['address_2'][df3['ID'] == '102591831'] = '49.47082213504419, 17.01841195530714'
df3['address_2'][df3['ID'] == '181058260'] = '48.932739996226346, 15.686178770625474'
df3['address_2'][df3['ID'] == '108035727'] = '49.79288628247885, 17.62378088230638'
df3['address_2'][df3['ID'] == '102692424'] = '50.31112466112202, 17.155736543399872'
df3['address_2'][df3['ID'] == '110250958'] = '49.26050205879534, 16.036339638623517'
df3['address_2'][df3['ID'] == '110301021'] = '49.462917407166046, 17.116385426470682'
df3['address_2'][df3['ID'] == '110400542'] = '49.16950427831417, 13.885607270636793'
df3['address_2'][df3['ID'] == '110400691'] = '50.82836600146331, 14.702413510732878'
df3['address_2'][df3['ID'] == '110501161'] = '49.75405044016851, 18.33950724056137'
df3['address_2'][df3['ID'] == '000412074'] = '51.011154195511004, 14.359466135386068'
df3['location2'] = df3['address_2'].apply(geocode)
df3['point2'] = df3['location2'].apply(lambda loc: tuple(loc.point) if loc else None)
df3.head()
# now we jus need to create a final column with te point
# ths is logical statement, if point1 is None than fill with point 2, otherwise fill with point1
df3['point_final'] = np.where(df3['point'].isna(),df3['point2'],df3['point'])
df3['point_final'].isna().describe()
count 167
unique 1
top False
freq 167
Name: point_final, dtype: object
Success, all the addresses are filled.
Making the points spatial
We know this is all in WGS84 so we just need to convert the dataset into spatial geopandas dataset.
df3.head()
| ID | ruian | druh | address_1 | address_2 | postcode | plna | location | point | location2 | point2 | point_final | |
|---|---|---|---|---|---|---|---|---|---|---|---|---|
| 4901 | 150069812 | 3089011 | Dětský domov | Přestavlky 1 | 257 91 Sedlec-Prčice | 257 91 | Přestavlky 1 , 257 91 Sedlec-Prčice | (u Černčického rybníka, Dlážděná, Sedlec u Vot... | (49.5702975, 14.5327368, 0.0) | (Sedlec-Prčice, okres Příbram, Střední Čechy, ... | (49.5726082, 14.5326911, 0.0) | (49.5702975, 14.5327368, 0.0) |
| 4910 | 150018312 | 2929724 | Dětský domov | Racek 1 | 256 01 Chlístov | 256 01 | Racek 1 , 256 01 Chlístov | (ev.1, Racek, Chlístov, okres Benešov, Střední... | (49.8051895, 14.6632285, 0.0) | (Chlístov, okres Benešov, Střední Čechy, Česko... | (49.8015212, 14.6547167, 0.0) | (49.8051895, 14.6632285, 0.0) |
| 4927 | 151038147 | 5936675 | Dětský domov | Mládeže 1102/8 | Beroun-Město | 266 01 | Mládeže 1102/8 , Beroun-Město | (1102/8, Mládeže, Beroun-Město, Beroun, Jarov,... | (49.9543712, 14.0503775, 0.0) | (Beroun-Město, Beroun, okres Beroun, Střední Č... | (49.9616066, 14.0675721, 0.0) | (49.9543712, 14.0503775, 0.0) |
| 4973 | 048706302 | 1377931 | Dětský domov | č.p. 55 | 273 05 Ledce | 273 05 | č.p. 55 , 273 05 Ledce | None | None | (Ledce, okres Brno-venkov, Jihomoravský kraj, ... | (49.0515031, 16.5570155, 0.0) | (49.0515031, 16.5570155, 0.0) |
| 5026 | 150036787 | 11647388 | Dětský domov | Poštovní 593 | 285 22 Zruč nad Sázavou | 285 22 | Poštovní 593 , 285 22 Zruč nad Sázavou | (Poštovní, Domahoř, Zruč nad Sázavou, okres Ku... | (49.7442708, 15.0883736, 0.0) | (Zruč nad Sázavou, okres Kutná Hora, Střední Č... | (49.740296, 15.106074, 0.0) | (49.7442708, 15.0883736, 0.0) |
# clean
df4 = df3.iloc[:,[0,1,2,3,4,6,11]].rename(columns={"point_final": "point"})
df4.head()
| ID | ruian | druh | address_1 | address_2 | plna | point | |
|---|---|---|---|---|---|---|---|
| 4901 | 150069812 | 3089011 | Dětský domov | Přestavlky 1 | 257 91 Sedlec-Prčice | Přestavlky 1 , 257 91 Sedlec-Prčice | (49.5702975, 14.5327368, 0.0) |
| 4910 | 150018312 | 2929724 | Dětský domov | Racek 1 | 256 01 Chlístov | Racek 1 , 256 01 Chlístov | (49.8051895, 14.6632285, 0.0) |
| 4927 | 151038147 | 5936675 | Dětský domov | Mládeže 1102/8 | Beroun-Město | Mládeže 1102/8 , Beroun-Město | (49.9543712, 14.0503775, 0.0) |
| 4973 | 048706302 | 1377931 | Dětský domov | č.p. 55 | 273 05 Ledce | č.p. 55 , 273 05 Ledce | (49.0515031, 16.5570155, 0.0) |
| 5026 | 150036787 | 11647388 | Dětský domov | Poštovní 593 | 285 22 Zruč nad Sázavou | Poštovní 593 , 285 22 Zruč nad Sázavou | (49.7442708, 15.0883736, 0.0) |
# get and XY columns and clean
df4['point'] = df4['point'].astype(str)
df4[['x','y', 'z']] = df4.point.str.split(n=3, expand=True)
df4['x'] = df4['x'].str[1:-1]
df4['y'] = df4['y'].str[:-1]
df5 = df4.iloc[:,[0,1,2,3,4,5,6,7,8]]
df5.head()
| ID | ruian | druh | address_1 | address_2 | plna | point | x | y | |
|---|---|---|---|---|---|---|---|---|---|
| 4901 | 150069812 | 3089011 | Dětský domov | Přestavlky 1 | 257 91 Sedlec-Prčice | Přestavlky 1 , 257 91 Sedlec-Prčice | (49.5702975, 14.5327368, 0.0) | 49.5702975 | 14.5327368 |
| 4910 | 150018312 | 2929724 | Dětský domov | Racek 1 | 256 01 Chlístov | Racek 1 , 256 01 Chlístov | (49.8051895, 14.6632285, 0.0) | 49.8051895 | 14.6632285 |
| 4927 | 151038147 | 5936675 | Dětský domov | Mládeže 1102/8 | Beroun-Město | Mládeže 1102/8 , Beroun-Město | (49.9543712, 14.0503775, 0.0) | 49.9543712 | 14.0503775 |
| 4973 | 048706302 | 1377931 | Dětský domov | č.p. 55 | 273 05 Ledce | č.p. 55 , 273 05 Ledce | (49.0515031, 16.5570155, 0.0) | 49.0515031 | 16.5570155 |
| 5026 | 150036787 | 11647388 | Dětský domov | Poštovní 593 | 285 22 Zruč nad Sázavou | Poštovní 593 , 285 22 Zruč nad Sázavou | (49.7442708, 15.0883736, 0.0) | 49.7442708 | 15.0883736 |
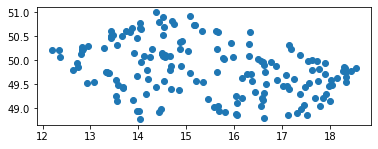
homes = gpd.GeoDataFrame(df5, geometry=gpd.points_from_xy(df5.y, df5.x))
homes.plot();
Munging data for choropleth map
# Load checked homes
homes2 = pd.read_excel('./dohledat_Ver.xlsx', sheet_name='Sheet1')
homes2.head()
| ID_left | druh | address_1 | address_2 | plna | x | y | geometry | okres | Kraj | Existuje | check | |
|---|---|---|---|---|---|---|---|---|---|---|---|---|
| 0 | 150018312 | Dětský domov | Racek 1 | 256 01 Chlístov | Racek 1 , 256 01 Chlístov | 49.805190 | 14.663229 | POINT (14.6632285 49.8051895) | Benešov | Středočeský kraj | ANO | 1 |
| 1 | 108003990 | Dětský domov | Senohrabská 112 | 251 67 Pyšely | Senohrabská 112 , 251 67 Pyšely | 49.878053 | 14.679728 | POINT (14.6797284 49.8780534) | Benešov | Středočeský kraj | ANO | 1 |
| 2 | 102238324 | Dětský domov | Benešovská 7 | 285 06 Sázava | Benešovská 7 , 285 06 Sázava | 49.871872 | 14.896189 | POINT (14.8961892 49.8718717) | Benešov | Středočeský kraj | ano | 1 |
| 3 | 151038147 | Dětský domov | Mládeže 1102/8 | Beroun-Město | Mládeže 1102/8 , Beroun-Město | 49.954371 | 14.050377 | POINT (14.0503775 49.9543712) | Beroun | Středočeský kraj | ANO | 1 |
| 4 | 150008732 | Dětský domov | Štefanikova 2344/2b | 680 01 Boskovice | Štefanikova 2344/2b , 680 01 Boskovice | 49.495124 | 16.660245 | POINT (16.660245 49.4951238) | Blansko | Jihomoravský kraj | ANO | 1 |
homes = gpd.GeoDataFrame(homes2, geometry=gpd.points_from_xy(homes2.y, homes2.x))
homes.loc[homes['check'] == 1]
| ID_left | druh | address_1 | address_2 | plna | x | y | geometry | okres | Kraj | Existuje | check | |
|---|---|---|---|---|---|---|---|---|---|---|---|---|
| 0 | 150018312 | Dětský domov | Racek 1 | 256 01 Chlístov | Racek 1 , 256 01 Chlístov | 49.805190 | 14.663229 | POINT (14.66323 49.80519) | Benešov | Středočeský kraj | ANO | 1 |
| 1 | 108003990 | Dětský domov | Senohrabská 112 | 251 67 Pyšely | Senohrabská 112 , 251 67 Pyšely | 49.878053 | 14.679728 | POINT (14.67973 49.87805) | Benešov | Středočeský kraj | ANO | 1 |
| 2 | 102238324 | Dětský domov | Benešovská 7 | 285 06 Sázava | Benešovská 7 , 285 06 Sázava | 49.871872 | 14.896189 | POINT (14.89619 49.87187) | Benešov | Středočeský kraj | ano | 1 |
| 3 | 151038147 | Dětský domov | Mládeže 1102/8 | Beroun-Město | Mládeže 1102/8 , Beroun-Město | 49.954371 | 14.050377 | POINT (14.05038 49.95437) | Beroun | Středočeský kraj | ANO | 1 |
| 4 | 150008732 | Dětský domov | Štefanikova 2344/2b | 680 01 Boskovice | Štefanikova 2344/2b , 680 01 Boskovice | 49.495124 | 16.660245 | POINT (16.66024 49.49512) | Blansko | Jihomoravský kraj | ANO | 1 |
| ... | ... | ... | ... | ... | ... | ... | ... | ... | ... | ... | ... | ... |
| 170 | 151001308 | Dětský domov | 3. května 528 | 763 12 Vizovice | 3. května 528 , 763 12 Vizovice | 49.215309 | 17.849604 | POINT (17.84960 49.21531) | Zlín | Zlínský kraj | ANO | 1 |
| 171 | 150070462 | Dětský domov | Lazy VI 3695 | 760 01 Zlín | Lazy VI 3695 , 760 01 Zlín | 49.219676 | 17.681226 | POINT (17.68123 49.21968) | Zlín | Zlínský kraj | ANO | 1 |
| 172 | 110023587 | Dětský domov | Smolina 16 | 49.154827045632665, 17.996702689654494 | Smolina 16 , 766 01 Valašské Klobouky | 49.154843 | 17.996750 | POINT (17.99675 49.15484) | Zlín | Zlínský kraj | ANO | 1 |
| 173 | 102331146 | Dětský domov | Lazy1 | 760 01 Zlín | 760 01 Zlín | 49.219029 | 17.676235 | POINT (17.67624 49.21903) | Zlín | Zlínský kraj | ANO | 1 |
| 174 | 102867232 | Dětský domov | Hakenova 716/18 | 669 02 Znojmo | Hakenova 716/18 , 669 02 Znojmo | 48.851656 | 16.065432 | POINT (16.06543 48.85166) | Znojmo | Jihomoravský kraj | ANO | 1 |
137 rows × 12 columns
homes.crs = wgs84
gdf1 = gpd.sjoin(homes, distr, how="inner”, op='intersects’) #gdf1.to_excel(‘dohledat.xlsx’)
distr.head()
| ID | KOD_NUTS3 | KOD_LAU1 | NAZEV_LAU1 | geometry | |
|---|---|---|---|---|---|
| 0 | 3100.0 | CZ010 | CZ0100 | Hlavní město Praha | POLYGON ((14.52826 49.99984, 14.52812 49.99975... |
| 1 | 3201.0 | CZ020 | CZ0201 | Benešov | POLYGON ((14.42653 49.81924, 14.42654 49.81976... |
| 2 | 3202.0 | CZ020 | CZ0202 | Beroun | POLYGON ((13.79700 49.82979, 13.79763 49.83013... |
| 3 | 3203.0 | CZ020 | CZ0203 | Kladno | POLYGON ((13.92115 50.21131, 13.92117 50.21135... |
| 4 | 3204.0 | CZ020 | CZ0204 | Kolín | POLYGON ((15.41584 50.10747, 15.41511 50.10730... |
#Aggregate the institution to districts
gdf1 = gpd.sjoin(homes, distr, how="inner", op='intersects')
gdf1 = gdf1[['ID_left','KOD_LAU1']]
df8 = gdf1.groupby(by=["KOD_LAU1"]).count().rename(columns={"ID_left": "count"})
df8.head()
| count | |
|---|---|
| KOD_LAU1 | |
| CZ0100 | 7 |
| CZ0201 | 3 |
| CZ0202 | 1 |
| CZ0203 | 2 |
| CZ0205 | 1 |
# double merge all the data together
distr_new = distr.merge(df8, on = 'KOD_LAU1')
distr_new = distr_new.merge(popul, left_on = 'KOD_LAU1', right_on = 'ID')
distr_new.head()
| ID_x | KOD_NUTS3 | KOD_LAU1 | NAZEV_LAU1 | geometry | count | ID_y | okres | pocet obyvatel | kraj | |
|---|---|---|---|---|---|---|---|---|---|---|
| 0 | 3100.0 | CZ010 | CZ0100 | Hlavní město Praha | POLYGON ((14.52826 49.99984, 14.52812 49.99975... | 7 | CZ0100 | Hlavní město Praha | 1324277 | Hlavní město Praha |
| 1 | 3201.0 | CZ020 | CZ0201 | Benešov | POLYGON ((14.42653 49.81924, 14.42654 49.81976... | 3 | CZ0201 | Benešov | 99414 | Středočeský kraj |
| 2 | 3202.0 | CZ020 | CZ0202 | Beroun | POLYGON ((13.79700 49.82979, 13.79763 49.83013... | 1 | CZ0202 | Beroun | 95058 | Středočeský kraj |
| 3 | 3203.0 | CZ020 | CZ0203 | Kladno | POLYGON ((13.92115 50.21131, 13.92117 50.21135... | 2 | CZ0203 | Kladno | 166483 | Středočeský kraj |
| 4 | 3205.0 | CZ020 | CZ0205 | Kutná Hora | POLYGON ((15.37964 50.02393, 15.38011 50.02372... | 1 | CZ0205 | Kutná Hora | 75828 | Středočeský kraj |
#Aggregate the institution to districts
gdf1 = gpd.sjoin(homes, region, how="inner", op='intersects')
gdf1 = gdf1[['ID_left','KOD_NUTS3']]
df8 = gdf1.groupby(by=["KOD_NUTS3"]).count().rename(columns={"ID_left": "count"})
df8.head()
| count | |
|---|---|
| KOD_NUTS3 | |
| CZ010 | 7 |
| CZ020 | 19 |
| CZ031 | 11 |
| CZ032 | 13 |
| CZ041 | 10 |
popul2 = popul[['kraj','pocet obyvatel']].groupby(['kraj']).sum()
popul2
| pocet obyvatel | |
|---|---|
| kraj | |
| Hlavní město Praha | 1324277 |
| Jihomoravský kraj | 1191989 |
| Jihočeský kraj | 644083 |
| Karlovarský kraj | 294664 |
| Kraj Vysočina | 509813 |
| Královéhradecký kraj | 551647 |
| Liberecký kraj | 443690 |
| Moravskoslezský kraj | 1200539 |
| Olomoucký kraj | 632015 |
| Pardubický kraj | 522662 |
| Plzeňský kraj | 589899 |
| Středočeský kraj | 1385141 |
| Zlínský kraj | 582555 |
| Ústecký kraj | 820965 |
# double merge all the data together
region_new = region.merge(df8, on = 'KOD_NUTS3')
region_new = region_new.merge(popul2, left_on = 'NAZEV_NUTS', right_on = 'kraj')
region_new.head()
| ID | KOD_NUTS3 | NAZEV_NUTS | geometry | count | pocet obyvatel | |
|---|---|---|---|---|---|---|
| 0 | 19.0 | CZ010 | Hlavní město Praha | POLYGON ((14.52826 49.99984, 14.52812 49.99975... | 7 | 1324277 |
| 1 | 27.0 | CZ020 | Středočeský kraj | POLYGON ((13.99190 50.30468, 13.99190 50.30468... | 19 | 1385141 |
| 2 | 35.0 | CZ031 | Jihočeský kraj | POLYGON ((14.66161 49.52495, 14.66296 49.52522... | 11 | 644083 |
| 3 | 43.0 | CZ032 | Plzeňský kraj | POLYGON ((13.79700 49.82979, 13.79704 49.82967... | 13 | 589899 |
| 4 | 51.0 | CZ041 | Karlovarský kraj | POLYGON ((13.24542 50.12623, 13.24539 50.12605... | 10 | 294664 |
# clean
distr_new2 = distr_new.iloc[[1,2,3,4,5,8,9]]
distr_new2.head()
# calculate homes per capita
# Per capita = measurement/number of people in a population
distr_new['per_thousand_people'] = (distr_new['count']/(distr_new['pocet obyvatel']/1000))
region_new['per_thousand_people'] = (region_new['count']/(region_new['pocet obyvatel']/1000))
distr_new.head()
| ID_x | KOD_NUTS3 | KOD_LAU1 | NAZEV_LAU1 | geometry | count | ID_y | okres | pocet obyvatel | kraj | per_thousand_people | |
|---|---|---|---|---|---|---|---|---|---|---|---|
| 0 | 3100.0 | CZ010 | CZ0100 | Hlavní město Praha | POLYGON ((14.52826 49.99984, 14.52812 49.99975... | 7 | CZ0100 | Hlavní město Praha | 1324277 | Hlavní město Praha | 0.005286 |
| 1 | 3201.0 | CZ020 | CZ0201 | Benešov | POLYGON ((14.42653 49.81924, 14.42654 49.81976... | 3 | CZ0201 | Benešov | 99414 | Středočeský kraj | 0.030177 |
| 2 | 3202.0 | CZ020 | CZ0202 | Beroun | POLYGON ((13.79700 49.82979, 13.79763 49.83013... | 1 | CZ0202 | Beroun | 95058 | Středočeský kraj | 0.010520 |
| 3 | 3203.0 | CZ020 | CZ0203 | Kladno | POLYGON ((13.92115 50.21131, 13.92117 50.21135... | 2 | CZ0203 | Kladno | 166483 | Středočeský kraj | 0.012013 |
| 4 | 3205.0 | CZ020 | CZ0205 | Kutná Hora | POLYGON ((15.37964 50.02393, 15.38011 50.02372... | 1 | CZ0205 | Kutná Hora | 75828 | Středočeský kraj | 0.013188 |
Plot choropleth map
fig, ax = plt.subplots(figsize=(20,13), subplot_kw={'aspect':'equal'})
country.plot(ax=ax, facecolor="lightgrey", edgecolor="black", linewidth = 2)
distr_new.plot(column='per_thousand_people', scheme='Quantiles', k=4, legend=True,legend_kwds={'fontsize':15}, ax=ax,
cmap='Blues')
region_new.geometry.boundary.plot(color = None,edgecolor="green", linewidth = 0.5, ax=ax)
ax.set_title('Number of Children homes per thousand people in Czech districts. Each Class contain 25% of all homes. Grey indicates no homes in the district', fontsize = 15)
ax.text(16,48.5, 'Source: rejstriky.msmt.cz/opendata/vrejcelk, Author: Lenka Hasova, MSc, lenkahas.com', fontsize=10)
region_new.apply(lambda x: ax.annotate(s=x.NAZEV_NUTS, xy=x.geometry.centroid.coords[0], ha='center',color= 'black', size = 12, path_effects=[pe.withStroke(linewidth=0.5, foreground="white")]),axis=1)
ax.axis('off');

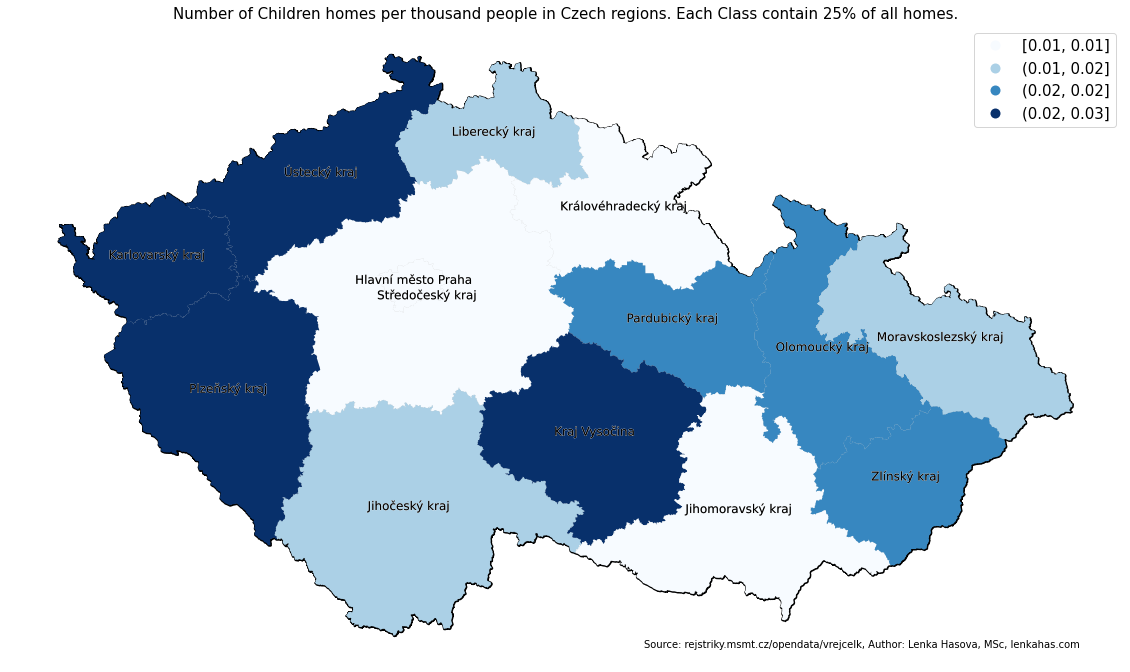
fig, ax = plt.subplots(figsize=(20,13), subplot_kw={'aspect':'equal'})
country.plot(ax=ax, facecolor="lightgrey", edgecolor="black", linewidth = 2)
region_new.plot(column='per_thousand_people', scheme='Quantiles', k=4, legend=True,legend_kwds={'fontsize':15}, ax=ax,
cmap='Blues')
ax.set_title('Number of Children homes per thousand people in Czech regions. Each Class contain 25% of all homes.', fontsize = 15)
ax.text(16,48.5, 'Source: rejstriky.msmt.cz/opendata/vrejcelk, Author: Lenka Hasova, MSc, lenkahas.com', fontsize=10)
region_new.apply(lambda x: ax.annotate(s=x.NAZEV_NUTS, xy=x.geometry.centroid.coords[0], ha='center',color= 'black', size = 12, path_effects=[pe.withStroke(linewidth=0.5, foreground="white")]),axis=1)
ax.axis('off');
Plot markers
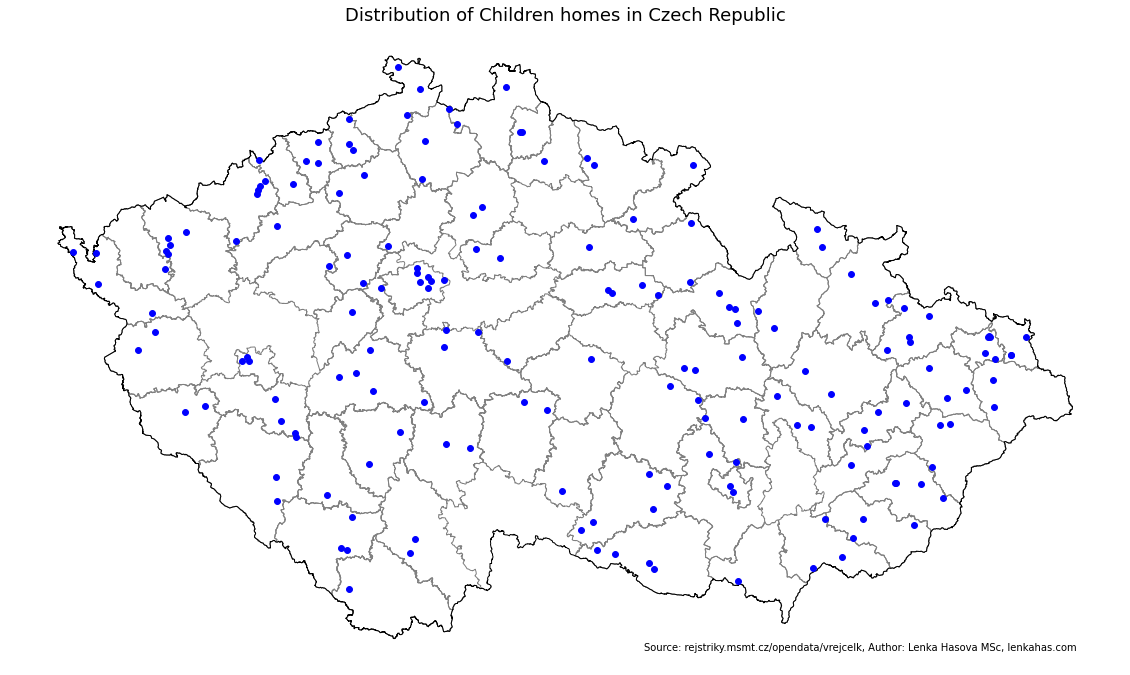
fig, ax = plt.subplots(figsize=(20,130), subplot_kw={'aspect':'equal'})
distr_new.plot(edgecolor = 'grey', facecolor='none', ax=ax)
ax.set_title('Distribution of Children homes in Czech Republic', fontsize = 18)
country.plot(ax=ax, facecolor="none", edgecolor="black")
homes.plot(color = 'blue', ax = ax, markersize = 35)
ax.text(16,48.5, 'Source: rejstriky.msmt.cz/opendata/vrejcelk, Author: Lenka Hasova MSc, lenkahas.com', fontsize=10)
ax.axis('off');
Making interactive maps
As you can see, the interactive map wioth folium did not work as expected. Forstly the popups are not working and secondly, the choropleth maps is not showing correctly. I have no idea about the first one, but secodn might be due to a wrong definition of geometrical layer for the choropleth. Please let me know if you spot the issue.
Happy Coding!
# get centrooids for the map
x_map=homes.centroid.x.mean()
y_map=homes.centroid.y.mean()
print(x_map,y_map)
15.47750331531277 49.827483377983235
# source http://andrewgaidus.com/leaflet_webmaps_python/
def add_point_clusters(mapobj, gdf, popup_field_list):
#Create empty lists to contain the point coordinates and the point pop-up information
coords, popups = [], []
#Loop through each record in the GeoDataFrame
for i, row in gdf.iterrows():
#Append lat and long coordinates to "coords" list
coords.append([row.geometry.y, row.geometry.x])
#Create a string of HTML code used in the IFrame popup
#Join together the fields in "popup_field_list" with a linebreak between them
label = '<br>'.join([row[field] for field in popup_field_list])
#Append an IFrame that uses the HTML string to the "popups" list
popups.append(IFrame(label, width = 400, height =100))
#Create a Folium feature group for this layer, since we will be displaying multiple layers
pt_lyr = folium.FeatureGroup(name = 'Domovy')
#Add the clustered points of crime locations and popups to this layer
pt_lyr.add_children(MarkerCluster(locations = coords, popups = popups))
#Add this point layer to the map object
mapobj.add_children(pt_lyr)
return mapobj
def add_choropleth(mapobj, gdf, id_field, value_field, fill_color = 'YlOrRd', fill_opacity = 0.6,
line_opacity = 0.2, num_classes = 5, classifier = 'Fisher_Jenks'):
#Allow for 3 Pysal map classifiers to display data
#Generate list of breakpoints using specified classification scheme. List of breakpoint will be input to choropleth function
if classifier == 'Fisher_Jenks':
threshold_scale=mapclassify.FisherJenks(gdf[value_field], k = num_classes).bins.tolist()
if classifier == 'Equal_Interval':
threshold_scale=mapclassify.EqualInterval(gdf[value_field], k = num_classes).bins.tolist()
if classifier == 'Quantiles':
threshold_scale=mapclassify.Quantiles(gdf[value_field], k = num_classes).bins.tolist()
#Convert the GeoDataFrame to WGS84 coordinate reference system
gdf_wgs84 = gdf.to_crs({'init': 'epsg:4326'})
#Call Folium choropleth function, specifying the geometry as a the WGS84 dataframe converted to GeoJSON, the data as
#the GeoDataFrame, the columns as the user-specified id field and and value field.
#key_on field refers to the id field within the GeoJSON string
mapobj.choropleth(geo_str = gdf_wgs84.to_json(), data = gdf,
columns = [id_field, value_field], key_on = 'feature.properties.{}'.format(id_field),
fill_color = fill_color, fill_opacity = fill_opacity, line_opacity = line_opacity,
threshold_scale = threshold_scale)
return mapobj
mymap = folium.Map(location=[y_map, x_map], zoom_start=7,tiles=None)
folium.TileLayer('CartoDB positron',name="Light Map",control=False).add_to(mymap)
#Update choropleth with point clusters
mymap = add_point_clusters(mymap, homes, [ 'plna','druh'])
#Update basemap with choropleth
folium.Choropleth(
geo_data=distr_new,
name='choropleth',
data=distr_new,
columns=['NAZEV_LAU1', 'per_thousand_people'],
key_on='feature.id',
fill_color='YlGn',
fill_opacity=0.7,
line_opacity=0.2,
legend_name='per_thousand_people'
).add_to(mymap)
folium.LayerControl().add_to(mymap)
mymap